02/2025 - Concerning Markets
Full written article below with sources.
Disclaimer: Because of the increased regulation and compliance in the financial industry, I want to start with saying everything in this newsletter is based on my opinion and is not predictive in any way.
The start of 2025 has been full of concerns about the current investing landscape. In this month’s newsletter I’ll attempt to outline some of the most common concerns I’ve been reading/hearing then provide guidance on what to do.
Trade Policies and Tariffs – At the start of February 2025, this concern is front and center. With the US still threating to implement 25% tariffs on Mexico/Canada and another 10% on China. I’m guessing these countries will then impose tariffs on other the US. What’s more, Canada’s GDP has declined in eight of the last nine quarters. I can’t imagine Canada’s economy is positioned well for these potential tariffs. Sourced from CNBC.com and RBC.com
Inflation and Interest Rates – While inflation has come down from its post-Covid peak, it’s still being stubborn on coming down to the Fed’s desired 2% target. Currently, Wells Fargo is forecasting a rate close to 2.5-2.6% over the next year. Partly because of inflation, the Federal Reserve has paused it’s rate cutting activity. However, the labor market looks solid which does complicate some of the Federal Reserve’s decisions. Sourced from Investopedia, TradingEconomics.com, and Federal Reserve
Geopolitical – 2024 was full of Geopolitical concerns and it looks like 2025 will continue this theme. The Russian/Ukraine war is still active. Israel/Iran and other proxy entities continue their conflicts which threatens shipping, energy, and other commerce. The collapse of the Assad regime in Syria. Increased Chinese activity around Taiwan along with North Korea posturing continues to increase potential regional friction. Sourced from ControlRisks.com and Wellington.com
US Growth Deceleration – Even though the labor market is tight, there are some rumblings of a slowing GDP. Time will tell an interesting story this year. The Conference Board forecasts real GDP to slow to 2.3% versus a prior projection of 2.8% in 2024. Additionally part of the potential slow down is due to some of the previously mentioned concerns. Sourced from Visa.com, GoldmanSachs.com
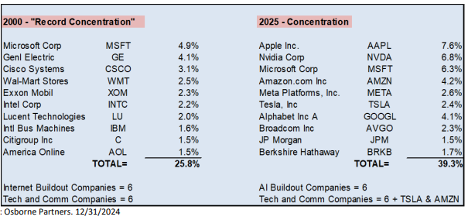
Concentrated S&P 500 – At the start of 2025, the top 10 companies in the S&P 500 comprised about 40% of the entire index. I’m not that good at math, but even I can calculate that this leaves the other 60% to the remaining 490 companies. Something interesting to me is that just two years ago these same companies only made up about 20% of the S&P 500 index. The last time we saw this type of concentration was in 1980 and again in the year 2000. In both of these historical instances, the “top 10” companies underperformed in the following years. Sourced from
BUT… Let’s just take a minute and think… Yes, 2025 is full of “concerns” – but isn’t each year full of it’s own concerns? My argument is yes, each year bring it’s own challenges, so then the encouragement is ask ourselves….
WHEN, not if, the markets decline we need to ask ourselves, did my time horizon change? Did my long-term goals change? If the answer on these two are “no” then we very likely don’t need to change your investment allocation.
Last data point is a chart I’ve shown numerous times before – it’s shows the regularity of market declines. I share this frequently because historically, the broader market moves in two directions. Just because 2023 and 2024 moved higher, don’t be surprised when the market moves lower.

Additional Data: Each month I get asked by clients what additional resources I’m looking at. Please hear me in stating I’m not trying to predict anything whatsoever, just some of the interesting data I’m watching.
- Bubble? – This article from Howard Marks discusses the current market concentration, some of which I pointed out earlier in the newsletter. Marks continues in this theme with focusing on the emotional aspect. For anyone “feeling” the fear of missing out (FOMO), I’ll encourage you to read this article.
- Is a Stock or Bond Portfolio Better? – I always find this chart to be interesting. If you look closely, you can see that depending on the length of time, the historical portfolio allocation winner becomes clear.

Click on the link for full disclosures - https://am.jpmorgan.com/us/en/asset-management/institutional/insights/market-insights/guide-to-the-markets/
- Trillions in Money Markets – At it’s highest level ever reported, there’s now 6.8T in money market funds. In the investing market, this is called “Dry Powder.” These are dollars enjoying higher levels of interest than in years past. But ask yourself, what do you think will happen when/if the Federal reserve starts to cut interest rates and banks start paying less in interest on these accounts? Do you really think people will just continue to hold their funds with less interest, or do you think they’ll look for other alternatives to make money? My guess is assuming interest rates come down, these people will start to move some of these funds back into the broader market. So what do you think would likely happen to market prices if this does occur?
- Breakeven Inflation Rate - 5-Year Breakeven inflation rate is now 2.59%. When you study this chart, you’ll see it goes back to 2004.
- Federal Reserve Balance sheet – The Fed continues to follow through on it’s statement of reducing the balance sheet. We’re now down to $6.8T dollars in the balance sheet, last time we saw this was May 2020 levels and declining.
- Debt Interest Payments – Most in this country would agree that the Federal Debt is just too high, but did you realize that the interest payments on this debt is now over 1.1 trillion a year? What should we do about it? My guess is we should balance the government budget…. But no one is asking me.
In closing: We of course cannot control what the market does from here and we cannot predict when the next market downturn will occur. But we can control our behavior to these outside events and continue to stick with our long-term investment strategy.
As always, if you have any questions/concerns please contact me.
David Hobbs, CFP®
Wealth Advisor | Owner
Hobbs Wealth Management
**Case Study Disclosure** The case study presented is purely hypothetical and does not represent actual client results. This study is provided for educational purposes only. Similar, or even positive results, cannot be guaranteed. Each client has their own unique set of circumstances so products and strategies may not by suitable for all people. Please consult with a qualified professional before implementing any strategy discussed herein. No portion of this case study is to be interpreted as a testimonial or endorsement of the firms' investment advisory services.
Standard & Poor’s 500 (S&P 500) - a market-cap weighted index composed of the common stocks of 500 leading companies in leading industries of the U.S. economy.
Russell 2000 – The index measures the performance of the small-cap segment of the US equity universe. It is a subset of the Russell 3000 and includes approximately 2000 of the smallest securities based on a combination of their market cap and current index membership.
MSCI ACWI ex USA – The index measures the performance of the large and mid-cap segments of the particular regions, excluding USA equity securities, including developed and emerging market. It is free float-adjusted market-capitalization weighted.
Federal Funds Rate - refers to the target interest rate set by the Federal Open Market Committee (FOMC). This target is the rate at which commercial banks borrow and lend their excess reserves to each other overnight.
This report was prepared by Hobbs Wealth Management a State registered investment adviser under the Investment Advisers Act of 1940. Registration as an investment adviser does not imply a certain level of skill or training. The oral and written communications of an adviser provide you with information about which you determine to hire or retain an adviser. Neither the information nor any opinion expressed it so be construed as solicitation to buy or sell a security of personalized investment, tax, or legal advice. For more information please visit: https://adviserinfo.sec.gov/ and search for our firm name.
This newsletter is prepared to provide a degree of insight into the analysis used by Hobbs Wealth Management to make investment decisions. It is not a complete description of all factors used by Hobbs Wealth Management to make decisions on behalf of clients. The opinions included are not intended to be taken as fact, but are Hobbs Wealth Management’s interpretation of the impact of external events on investments.
The information herein was obtained from various sources. Hobbs Wealth Management does not guarantee the accuracy or completeness of information provided by third parties. The information in this report is given as of the date indicated and believed to be reliable. Hobbs Wealth Management assumes no obligation to update this information, or to advise on further developments relating to it.
This article contains external links directing you to a third-party website. Although we have reviewed the website prior to creating the link, we are not responsible for the content of the sites.
An index is an unmanaged portfolio of specific securities, the performance of which is often used as a benchmark in judging the relative performance of certain asset classes. Investors cannot invest directly in an index. An index does not charge management fees or brokerage expenses, and no such fees or expenses were deducted from the performance shown.
The mention of specific securities and sectors illustrates the application of our investment approach only and is not to be considered a recommendation. The specific securities identified and described herein do not represent all of the securities purchased or sold for the portfolio, and it should not be assumed that investment in these securities were or will be profitable. There is no assurance that the securities purchased remain in the portfolio or that securities sold have not been repurchased. For a complete list of holdings please contact your portfolio advisor.
Hobbs Wealth Management may discuss and display, charts, graphs, formulas, stock and sector picks which are not intended to be used by themselves to determine which securities to buy or sell, or when to buy or sell them. This specific information is limited and should not be used on their own to make investment decisions. This information is offered as educational only.